
E-Goniometer400: A Free Stereo Image and Phase Meter VST3
Analyse stereo width, left-right balance and phase correlation through a clear, resizable visual display.
E-Goniometer400 is a free stereo analysis plugin developed by Windows-G for producers, mixing engineers and mastering engineers working on Windows.
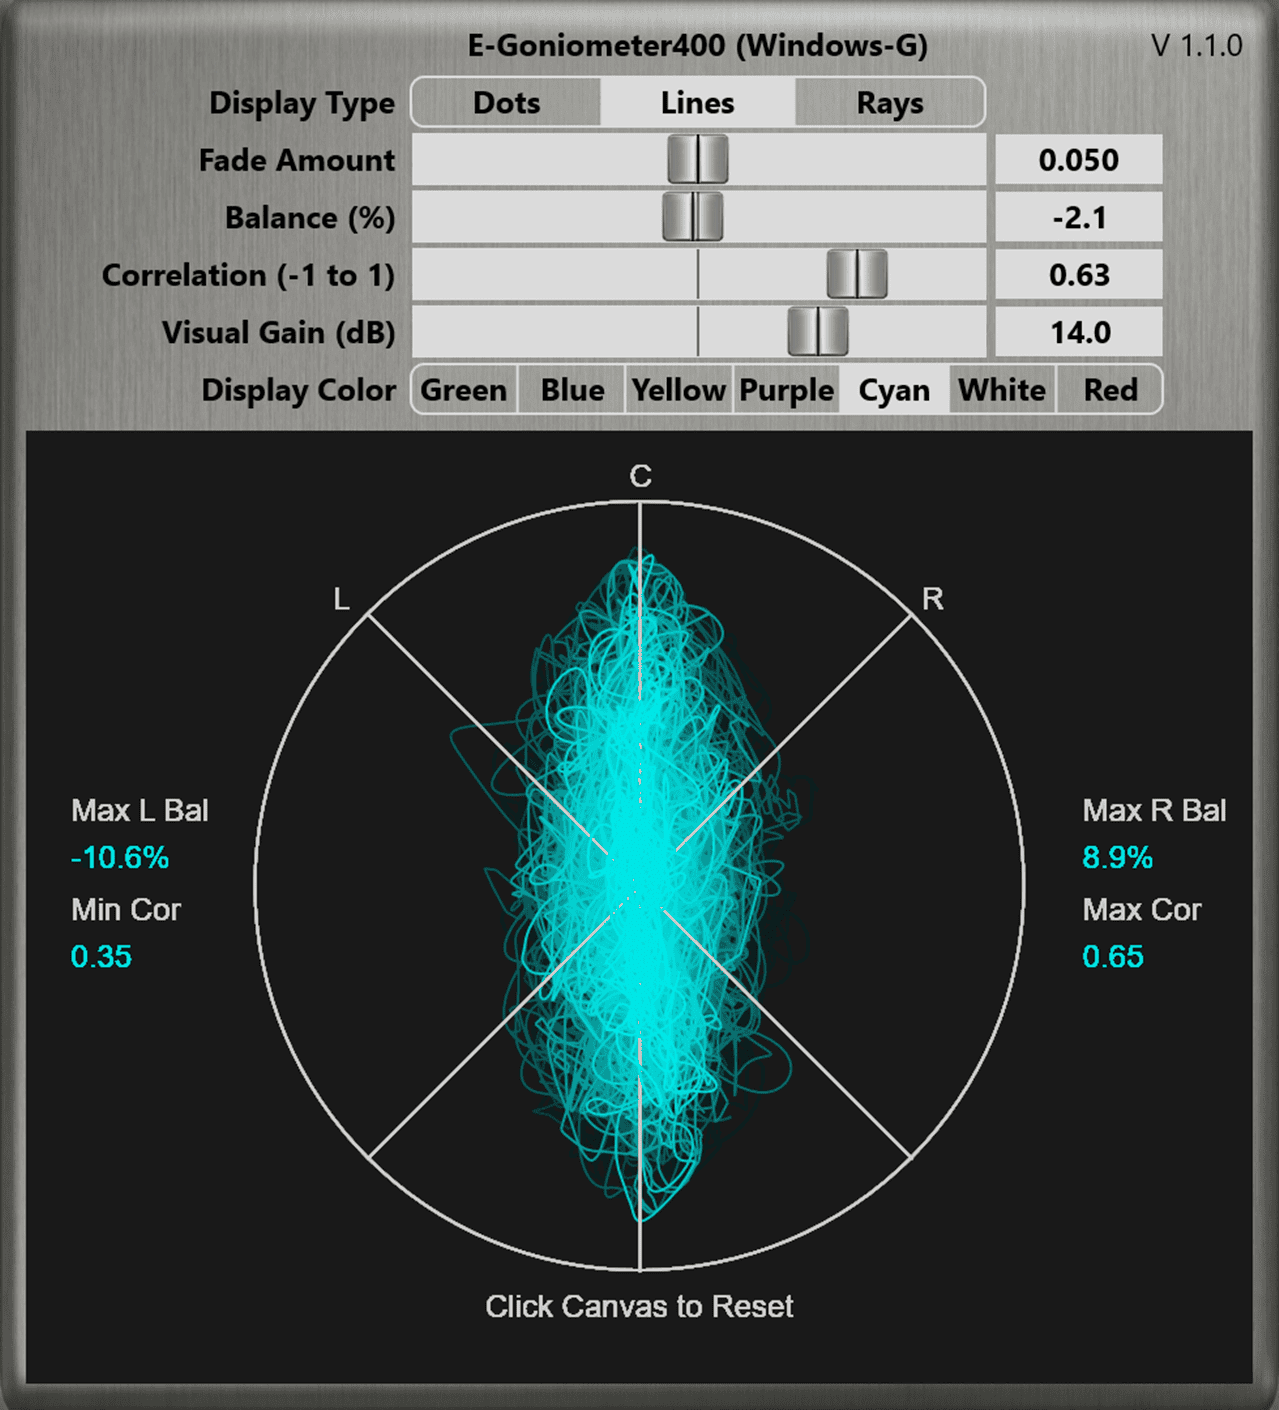
The plugin combines a traditional goniometer display with dedicated balance and phase-correlation meters. It can help identify excessive stereo width, uneven channel balance and phase relationships that may cause a mix to lose important information when played in mono.
Its interface provides several visualisation modes, adjustable display behaviour and persistent minimum and maximum readings for analysing complete sections of a track.
Completely free: Windows-G offers E-Goniometer400 through its official Gumroad store using a pay-what-you-want system. Enter 0 in the price field to download the VST3 edition without payment.
What Is E-Goniometer400?
E-Goniometer400 is a metering plugin designed to visualise the relationship between the left and right channels of a stereo audio signal.
A standard level meter shows how loud the signal is. A goniometer provides different information by displaying the shape created by the two channels and their phase relationship.
This can reveal whether a track is strongly centred, widely spread, unbalanced or likely to produce cancellation when converted to mono.
Main purpose: E-Goniometer400 helps producers evaluate stereo width and phase behaviour visually while still making the final decision by ear.
Main Features
- Real-time stereo goniometer display
- Dots, lines and rays visualisation modes
- Adjustable display fade time
- Selectable scope colours
- Visual gain control for quieter signals
- Left and right balance meter
- Phase-correlation meter
- Maximum left and right balance readouts
- Minimum and maximum correlation readouts
- Automatic readout reset when playback begins
- Manual reset by clicking the display
- Adjustable meter reaction time
- Resizable high-DPI interface
- Windows VST3 format
Three Display Modes
E-Goniometer400 provides three visual styles for displaying the stereo signal: dots, lines and rays.
Dots: Displays individual points for a detailed view of the signal distribution.
Lines: Connects the analysed positions to create a more continuous representation of stereo movement.
Rays: Draws the signal outward from the centre, making the direction and overall width easier to recognise quickly.
The best mode depends on the material and personal preference. Dots can reveal fine movement, while lines and rays may provide a clearer overview when analysing an entire mix.
Understanding the Goniometer Display
A narrow vertical shape generally indicates that most of the audio is concentrated around the centre and is likely to remain stable in mono.
A wider horizontal or circular pattern suggests stronger stereo information. Width is not automatically a problem, but an extremely horizontal display can indicate opposing left and right signals that may cancel when combined.
An uneven shape leaning heavily to one side may indicate that the track or mix is unbalanced between the left and right channels.
Important: There is no single perfect goniometer shape. A centred vocal, wide pad, stereo drum loop and complete master will naturally produce different displays.
Phase Correlation Metering
The correlation meter provides a numerical indication of the relationship between the left and right channels.
Values near +1: The left and right channels are strongly correlated and should generally remain stable in mono.
Values around 0: The channels contain more independent stereo information.
Negative values: Some information is moving out of phase and may cancel when the signal is summed to mono.
A brief negative movement is not always a serious problem. Reverbs, delays, modulation effects and wide ambience can temporarily create negative values.
Persistent negative readings on essential elements such as the kick, bass, lead vocal or main snare deserve closer investigation.
Minimum and Maximum Correlation Readouts
E-Goniometer400 records the lowest and highest correlation values reached during playback.
This is useful because phase problems may appear only during one transition, effect automation or short section of the arrangement.
The minimum reading makes it possible to notice these events even when the producer is not watching the meter at the exact moment they occur.
Analysis tip: Play the complete chorus or drop, then check the minimum correlation value. If it falls deeply into negative territory, repeat the section while bypassing stereo effects one at a time.
Left and Right Balance Analysis
The balance meter shows whether more energy is reaching the left or right channel.
E-Goniometer400 also records the maximum left and right positions reached during playback. These readings can help identify occasional imbalances that are difficult to notice from the main visual display alone.
An asymmetrical mix is not automatically incorrect. Guitars, percussion, backing vocals and effects may be intentionally placed on different sides.
The goal is to determine whether the overall distribution feels intentional and whether the main elements remain stable.
Mixing reminder: Do not correct every small balance difference automatically. Music is allowed to lean occasionally without filling out an incident report.
Visual Gain Control
Quiet audio may create a small display that is difficult to analyse. The Visual Gain control enlarges the scope presentation without changing the actual audio level.
This makes it possible to inspect quieter passages, ambience and low-level effects without increasing the volume of the track or master channel.
Because this control affects only the visualisation, it can be adjusted freely without changing the sound of the project.
Adjustable Fade Amount
The Fade Amount control changes how quickly the scope information disappears from the display.
A shorter fade provides a faster and more responsive visualisation. A longer fade leaves previous movements visible for more time, which can make the overall stereo shape easier to study.
Fast settings may be useful for drums and transient-heavy sounds. Longer settings can work well for pads, reverbs, sustained instruments and complete mixes.
Custom Display Colours
E-Goniometer400 includes a colour menu for changing the appearance of the scope.
This is mainly a workflow and visibility feature. A brighter or more contrasting colour may be easier to read on different monitors, in dark studio environments or when several analysis plugins are open simultaneously.
Resizable High-DPI Interface
The VST3 edition supports high-resolution displays and provides interface scaling through a right-click menu.
Right-click anywhere on the plugin interface and choose the preferred UI Zoom option. This allows the meter to remain readable on large or high-resolution screens.
Sliders can be double-clicked to return them to their default settings. Holding the Control key while dragging provides finer adjustment.
Where to Place E-Goniometer400
Master channel: Analyse the stereo image and phase behaviour of the complete mix.
Instrument buses: Check layered guitars, synthesizers, backing vocals or percussion groups.
Effect returns: Examine stereo reverbs, delays and modulation effects separately.
Bass channels: Confirm that important low-frequency information remains centred and mono-compatible.
Reference tracks: Compare the general stereo behaviour of a production with professionally released music.
The plugin does not change the sound, so it can remain on the master output during mixing. It should normally be placed after processors that affect stereo width or phase.
Using It on the Master Channel
Place E-Goniometer400 near the end of the master chain, after stereo imaging, EQ, compression and limiting processors.
Play important sections such as the chorus, drop and breakdown while observing both the visual shape and correlation values.
When a problem appears, return to the individual tracks rather than trying to repair everything on the master bus. Excessive width often comes from one reverb, chorus, stereo synthesizer or phase-shifting effect.
Recommended workflow: Use the meter to locate suspicious sections, switch the mix temporarily to mono, then bypass likely stereo processors until the source of the problem becomes clear.
Compatibility
- Plugin format: VST3
- Operating system: Windows
- Plugin type: Stereo analysis and metering effect
- Copy protection: None listed
- Paid licence: Not required
- Interface scaling: Supported through UI Zoom
- macOS VST3: Not available
- Linux VST3: Not available
Alternative for macOS and Linux: Windows-G also provides a separate JSFX edition. It can run natively in REAPER or through the free YSFX host in compatible VST3, AU and CLAP environments.
How to Download E-Goniometer400
- Open the official Windows-G Gumroad page.
- Enter 0 in the price field.
- Complete the free Gumroad checkout.
- Download and extract the supplied archive.
- Install the VST3 file in the standard Windows VST3 folder.
- Open the DAW and rescan the VST3 plugins if necessary.
- Load E-Goniometer400 on a stereo track, bus or master output.
Final Verdict
E-Goniometer400 is a focused free analysis plugin for producers who want a clearer understanding of stereo width, balance and phase behaviour.
Its combination of a configurable goniometer, correlation metering and persistent minimum and maximum readings provides more information than a simple stereo scope.
The Windows-only VST3 format is its main limitation. Mac and Linux users need to use the separate JSFX version through REAPER or a compatible YSFX host.
For Windows producers, however, E-Goniometer400 is a practical addition to the master channel. It will not make a mix wider, cleaner or more compatible automatically, but it can reveal when the stereo field is preparing a small rebellion behind the speakers.
Download E-Goniometer400 for Free
Get the Windows VST3 edition directly from the official Windows-G store.